10 Data Analyst Projects from GitHub That Can Make Your Resume Stand Out
A practical project list for SQL, Python, Excel, Tableau, Power BI, finance, HR, customer analytics, and business intelligence roles

Most data analyst resumes look the same because they only mention tools.
But strong resumes show business problems, KPIs, dashboards, SQL analysis, insights, and measurable impact.
So here are 10 GitHub projects that are worth studying, rebuilding, and customizing for your own resume. These projects cover different analyst skills like Excel, SQL, Python, Tableau, Power BI, finance analytics, HR analytics, customer behavior, data warehousing, and dashboard storytelling.
1. Pizza Sales Analysis Project
Github Link - https://github.com/ekaterinakham/SQL-Tableau-PowerBI-Excel-Pizza-Sales-Analysis-Project
Skills Covered - SQL, Excel, Power BI, Tableau, KPI dashboarding, sales analysis, revenue analysis
Why it’s strong for resume -
This is one of the best all-in-one beginner-to-intermediate projects because it covers SQL queries, Excel dashboarding, Power BI dashboarding, Tableau dashboarding, sales KPIs, best/worst sellers, revenue trends, and business performance analysis. It shows that you can analyze the same business problem across multiple tools.
Resume points -
i. Built an end-to-end pizza sales analytics project using SQL, Excel, Power BI, and Tableau to analyze revenue, order volume, product performance, and customer demand trends.
ii. Created interactive dashboards tracking 10+ KPIs including total revenue, average order value, total pizzas sold, daily trends, monthly trends, and category-level performance.
iii. Wrote SQL queries to identify top-selling and low-performing pizza categories, enabling data-driven recommendations for menu optimization and sales strategy.
iv. Designed multi-tool dashboard reports that reduced manual sales review effort by organizing key business metrics into one clear reporting workflow.
2. HR Analytics Project
Github Link - https://github.com/ekaterinakham/PowerBI-Tableau-SQL-Excel-HR-Analytics-Project
Skills Covered - HR analytics, SQL, Excel, Power BI, Tableau, workforce reporting, attrition analysis
Why it’s strong for resume -
This is a great project for people analytics and HR reporting roles. It covers employee metrics, attrition-style workforce analysis, Excel reporting, SQL documentation, Power BI dashboards, and Tableau dashboards. It is especially strong because HR analytics is used in almost every company.
Resume points -
i. Developed an HR analytics dashboard using SQL, Excel, Power BI, and Tableau to monitor employee count, workforce distribution, attrition patterns, and department-level trends.
ii. Analyzed employee data across multiple dimensions such as gender, department, job role, education field, and age group to identify workforce risk areas.
iii. Built 8+ HR KPIs and visual reports to help stakeholders understand attrition drivers, employee demographics, and retention opportunities.
iv. Transformed raw HR data into executive-ready dashboards, improving visibility into workforce health and supporting data-backed HR decisions.
3. Bank Loan Lending Data Analytics
Github Link - https://github.com/arnavchaturvedi17/Data-Analysis-Bank-Loan-Lending_Data_Analytics
Skills Covered - Finance analytics, SQL, Tableau, Excel, loan analysis, KPI tracking, risk reporting
Why it’s strong for resume -
This is a strong finance-domain project. It includes loan applications, funded amount, amount received, interest rate, loan status, loan purpose, SQL ETL, Tableau dashboarding, and Excel validation. This is excellent for data analyst, financial analyst, risk analyst, and business analyst resumes.
Resume points -
i. Analyzed bank loan lending data using SQL, Excel, and Tableau to evaluate loan applications, funded amounts, repayment performance, and borrower risk segments.
ii. Built financial KPI dashboards tracking 10+ metrics including total loan applications, funded amount, amount received, interest rate, debt-to-income ratio, and loan status.
iii. Used SQL to segment good loans versus bad loans and identify patterns across loan purpose, term, grade, employment length, and borrower profile.
iv. Created Tableau dashboards to support lending performance review and risk monitoring, helping translate raw loan records into clear business insights.
4. OLA Data Analyst Project
Github Link - https://github.com/PrajwalGpy/OLA-Data-Analyst-Project-Power-BI-And-SQL
Skills Covered - SQL, Power BI, ride-booking analytics, customer analytics, driver performance, revenue reporting
Why it’s strong for resume -
This is a solid business analytics project because it analyzes ride volumes, booking status, revenue by payment method, customer behavior, driver ratings, vehicle performance, and cancellation trends. It feels like a real analytics project from a marketplace or transportation company.
Resume points -
i. Built an OLA ride-booking analytics project using SQL and Power BI to analyze booking volume, revenue trends, cancellation patterns, and ride completion performance.
ii. Created dashboard views for 10+ operational KPIs including total bookings, successful rides, cancelled rides, revenue by payment method, vehicle type performance, and customer ratings.
iii. Used SQL queries to identify customer and driver behavior trends, including cancellation reasons, ride frequency, and revenue contribution by ride category.
iv. Delivered Power BI insights to support marketplace operations, customer experience improvement, and driver performance monitoring.
5. Customer Shopping Behavior Analytics
Github Link - https://github.com/amlanmohanty1/customer-trends-data-analysis-SQL-Python-PowerBI
Skills Covered - Python, SQL, Power BI, customer analytics, EDA, reporting, business presentation
Why it’s strong for resume -
This is one of the best end-to-end projects because it includes data import, exploratory analysis, cleaning, SQL loading, business question analysis, Power BI dashboarding, and reporting. It shows a full analyst workflow rather than only a dashboard.
Resume points -
i. Completed an end-to-end customer shopping behavior analysis using Python, SQL, and Power BI to uncover purchasing patterns, customer segments, and product trends.
ii. Cleaned and prepared customer transaction data using Python, improving dataset consistency before loading structured tables into SQL for analysis.
iii. Answered 15+ business questions using SQL, including sales trends, customer demographics, purchase frequency, product preferences, and revenue drivers.
iv. Built a Power BI dashboard and final business report to summarize key insights, helping connect customer behavior patterns with actionable retail recommendations.
6. Cyclistic Bike Share Case Study
Github Link - https://github.com/SomiaNasir/Google-Data-Analytics-Capstone-Cyclistic-Case-Study
Skills Covered - SQL, BigQuery, Tableau, business case study, customer behavior analysis, data storytelling
Why it’s strong for resume -
This project is strong because it follows a structured analyst process: Ask, Prepare, Process, Analyze, Share, and Act. It also includes SQL queries and Tableau visualizations. It is a good project for entry-level data analyst resumes because it shows business thinking, not just technical skills.
Resume points -
i. Conducted a Cyclistic bike-share case study using SQL and Tableau to compare usage behavior between casual riders and annual members.
ii. Processed and analyzed 12 months of trip data to identify patterns in ride duration, weekday usage, seasonal demand, and customer segment behavior.
iii. Built Tableau dashboards to visualize member conversion opportunities, peak usage periods, and differences in riding habits across customer groups.
iv. Recommended data-backed marketing strategies to increase annual memberships by targeting high-frequency casual riders and weekend-heavy users.
7. SQL Data Warehouse and Analytics Project
Github Link - https://github.com/DataWithBaraa/sql-data-warehouse-project
Skills Covered - SQL Server, ETL, data warehousing, star schema, data modeling, reporting, business analytics
Why it’s strong for resume -
This project can make a resume stand out because it goes beyond regular dashboarding. It covers data warehouse architecture, ETL, bronze/silver/gold layers, fact and dimension modeling, data quality checks, and SQL-based reporting. This is especially useful for data analyst, BI analyst, and analytics engineer roles.
Resume points -
i. Designed a SQL-based data warehouse using bronze, silver, and gold layers to transform raw sales data into structured analytics-ready tables.
ii. Built ETL workflows and data quality checks to clean, standardize, and validate customer, product, and sales datasets before reporting.
iii. Created fact and dimension tables using star schema modeling to support scalable reporting across customer behavior, product performance, and sales trends.
iv. Developed SQL analytics reports covering revenue trends, customer segmentation, product performance, and business growth metrics for BI use cases.
8. Data Analysis Portfolio by Rebekah
Github Link - https://github.com/rebekah999/Data-Analysis-Portfolio
Skills Covered - PostgreSQL, Excel, Python, EDA, sales analysis, inventory analysis, churn analysis
Why it’s strong for resume -
This is a strong reference portfolio because it includes multiple analyst-style projects. It covers SQL analysis, Excel exploration, property sales dashboards, S&P 500 data pipeline work, and employee churn analysis. It is helpful if you want to understand how to organize several projects in one GitHub portfolio.
Resume points -
i. Built a multi-project data analysis portfolio covering SQL, Excel, Python, sales analytics, inventory analysis, employee churn, and financial market data.
ii. Used PostgreSQL to analyze business datasets across orders, revenue, customers, inventory, and employee performance, answering 20+ analytical questions.
iii. Created Excel and dashboard-based reports to summarize sales trends, product performance, customer behavior, and operational efficiency.
iv. Organized multiple analysis projects into a clean GitHub portfolio structure, improving project readability for recruiters and hiring managers.
9. Maven Toys Sales Project Analysis
Github Link - https://github.com/Yash-Yennewar/Maven_Toys_Sales_Project_Analysis
Skills Covered - Power BI, DAX, data modeling, retail analytics, inventory analysis, sales performance
Why it’s strong for resume -
This is a good Power BI portfolio project. It uses a realistic retail dataset and focuses on revenue, profit, inventory efficiency, store performance, DAX calculations, relationships, maps, slicers, and business storytelling. This is a strong choice for anyone targeting BI analyst or Power BI analyst roles.
Resume points -
i. Developed a Power BI sales analytics dashboard for Maven Toys to monitor revenue, profit, store performance, product demand, and inventory efficiency.
ii. Built DAX measures and data model relationships to calculate 10+ business KPIs including total sales, profit margin, units sold, stock levels, and store-level performance.
iii. Analyzed product and location-level trends to identify high-performing stores, slow-moving products, and inventory optimization opportunities.
iv. Designed an interactive retail dashboard with slicers, maps, and category-level drilldowns to support faster business performance review.
10. Alex The Analyst Portfolio Projects
Github Link - https://github.com/AlexTheAnalyst/PortfolioProjects
Skills Covered - SQL, Python, data cleaning, Tableau, web scraping, API extraction, EDA
Why it’s strong for resume -
This repo is popular and useful for learning project structure. It includes SQL exploration, Nashville housing data cleaning, Tableau SQL queries, Python notebooks, web scraping, and API extraction. Use it as a reference, but customize your own version because many candidates already use this repo.
Resume points -
i. Completed multiple portfolio projects using SQL, Python, Tableau, web scraping, and API extraction to demonstrate end-to-end data analysis skills.
ii. Cleaned and transformed real-world datasets using SQL, including handling missing values, standardizing fields, removing duplicates, and preparing data for visualization.
iii. Performed exploratory analysis using SQL and Python to identify trends, patterns, and business insights across housing, COVID, and public datasets.
iv. Built Tableau-ready datasets and dashboards to communicate findings clearly through visual storytelling and stakeholder-friendly reporting.
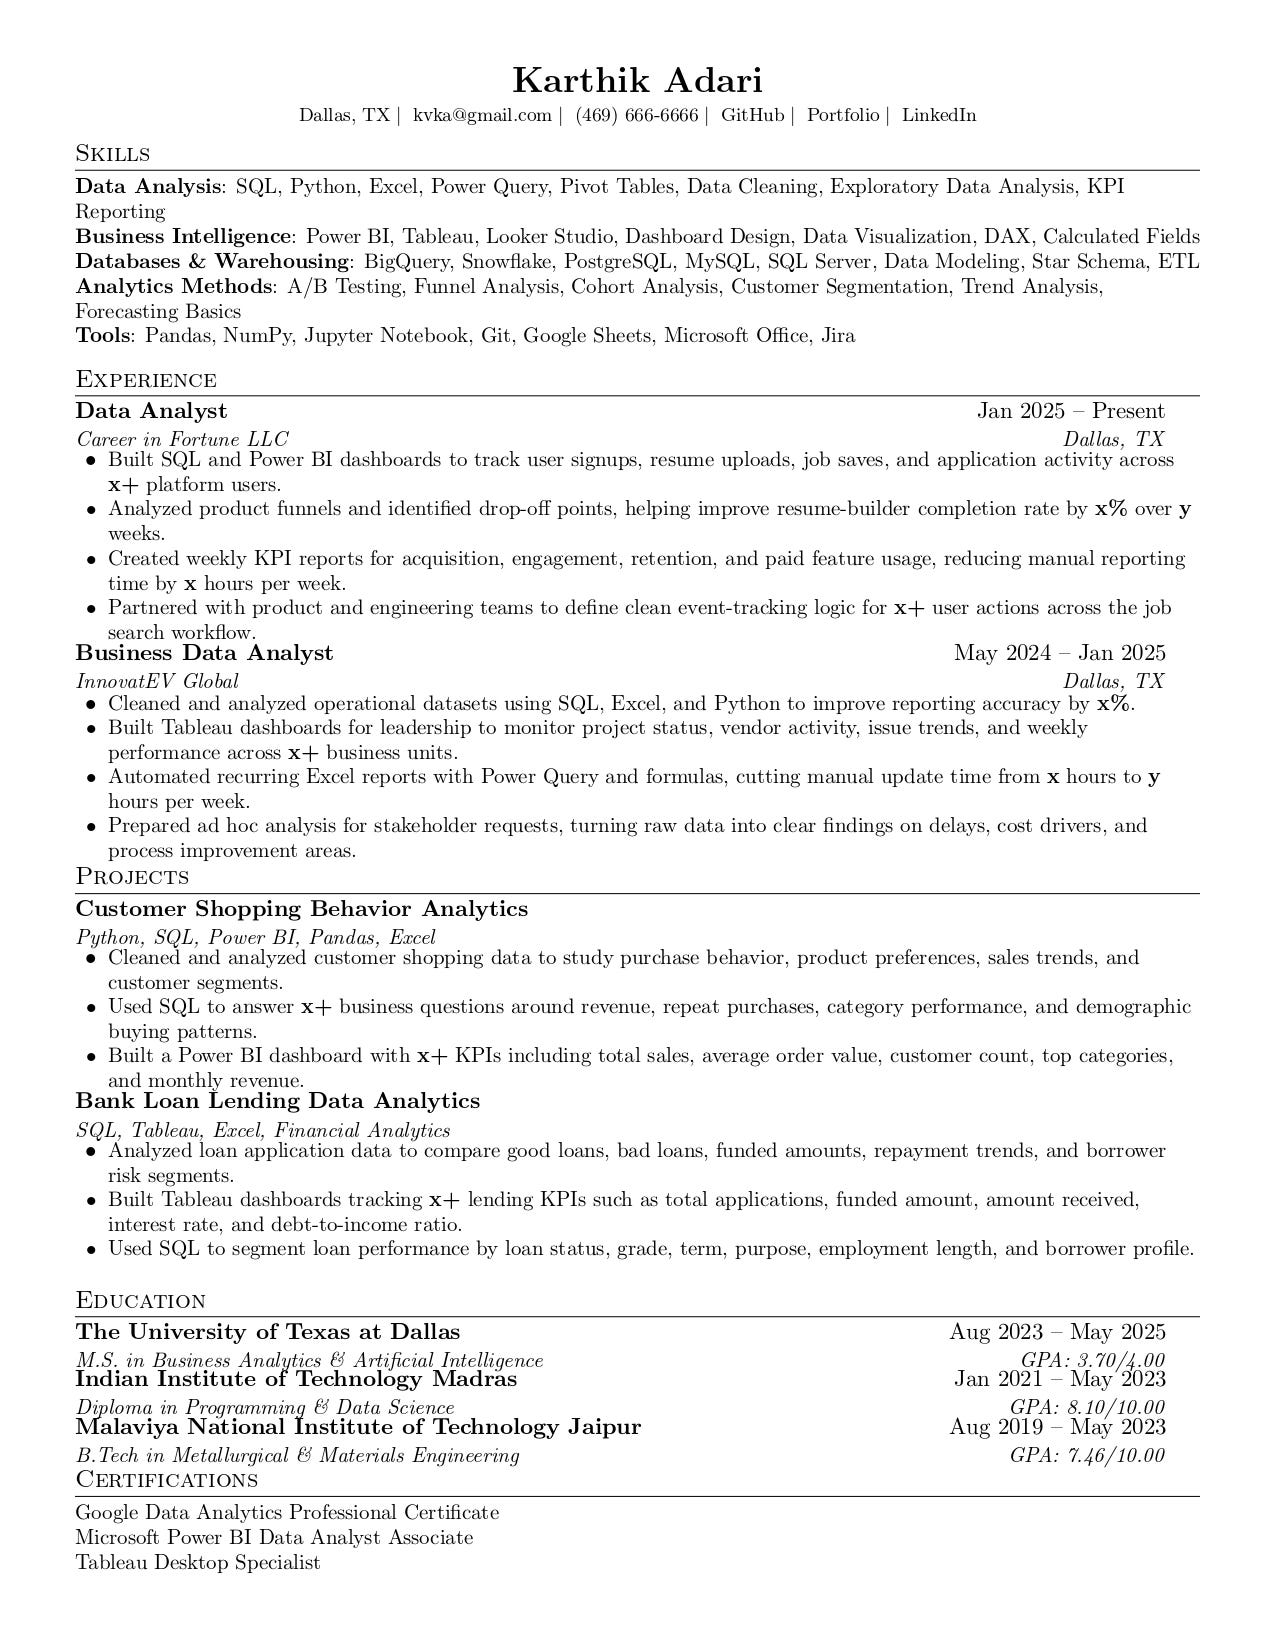
DEMO RESUME - Link
Ending Note
A strong data analyst resume does not need 20 projects.
It needs 3 solid projects that show:
SQL thinking,
dashboard storytelling,
business understanding,
clean data work,
and measurable insights.
My recommendation:
Build one project with SQL + Python,
one project with Power BI or Tableau,
and one project from a real business domain like finance, HR, retail, healthcare, or customer analytics.
Don’t just copy these GitHub projects. Rebuild them, improve the dashboards, add your own insights, and write stronger resume bullets around the business impact.